


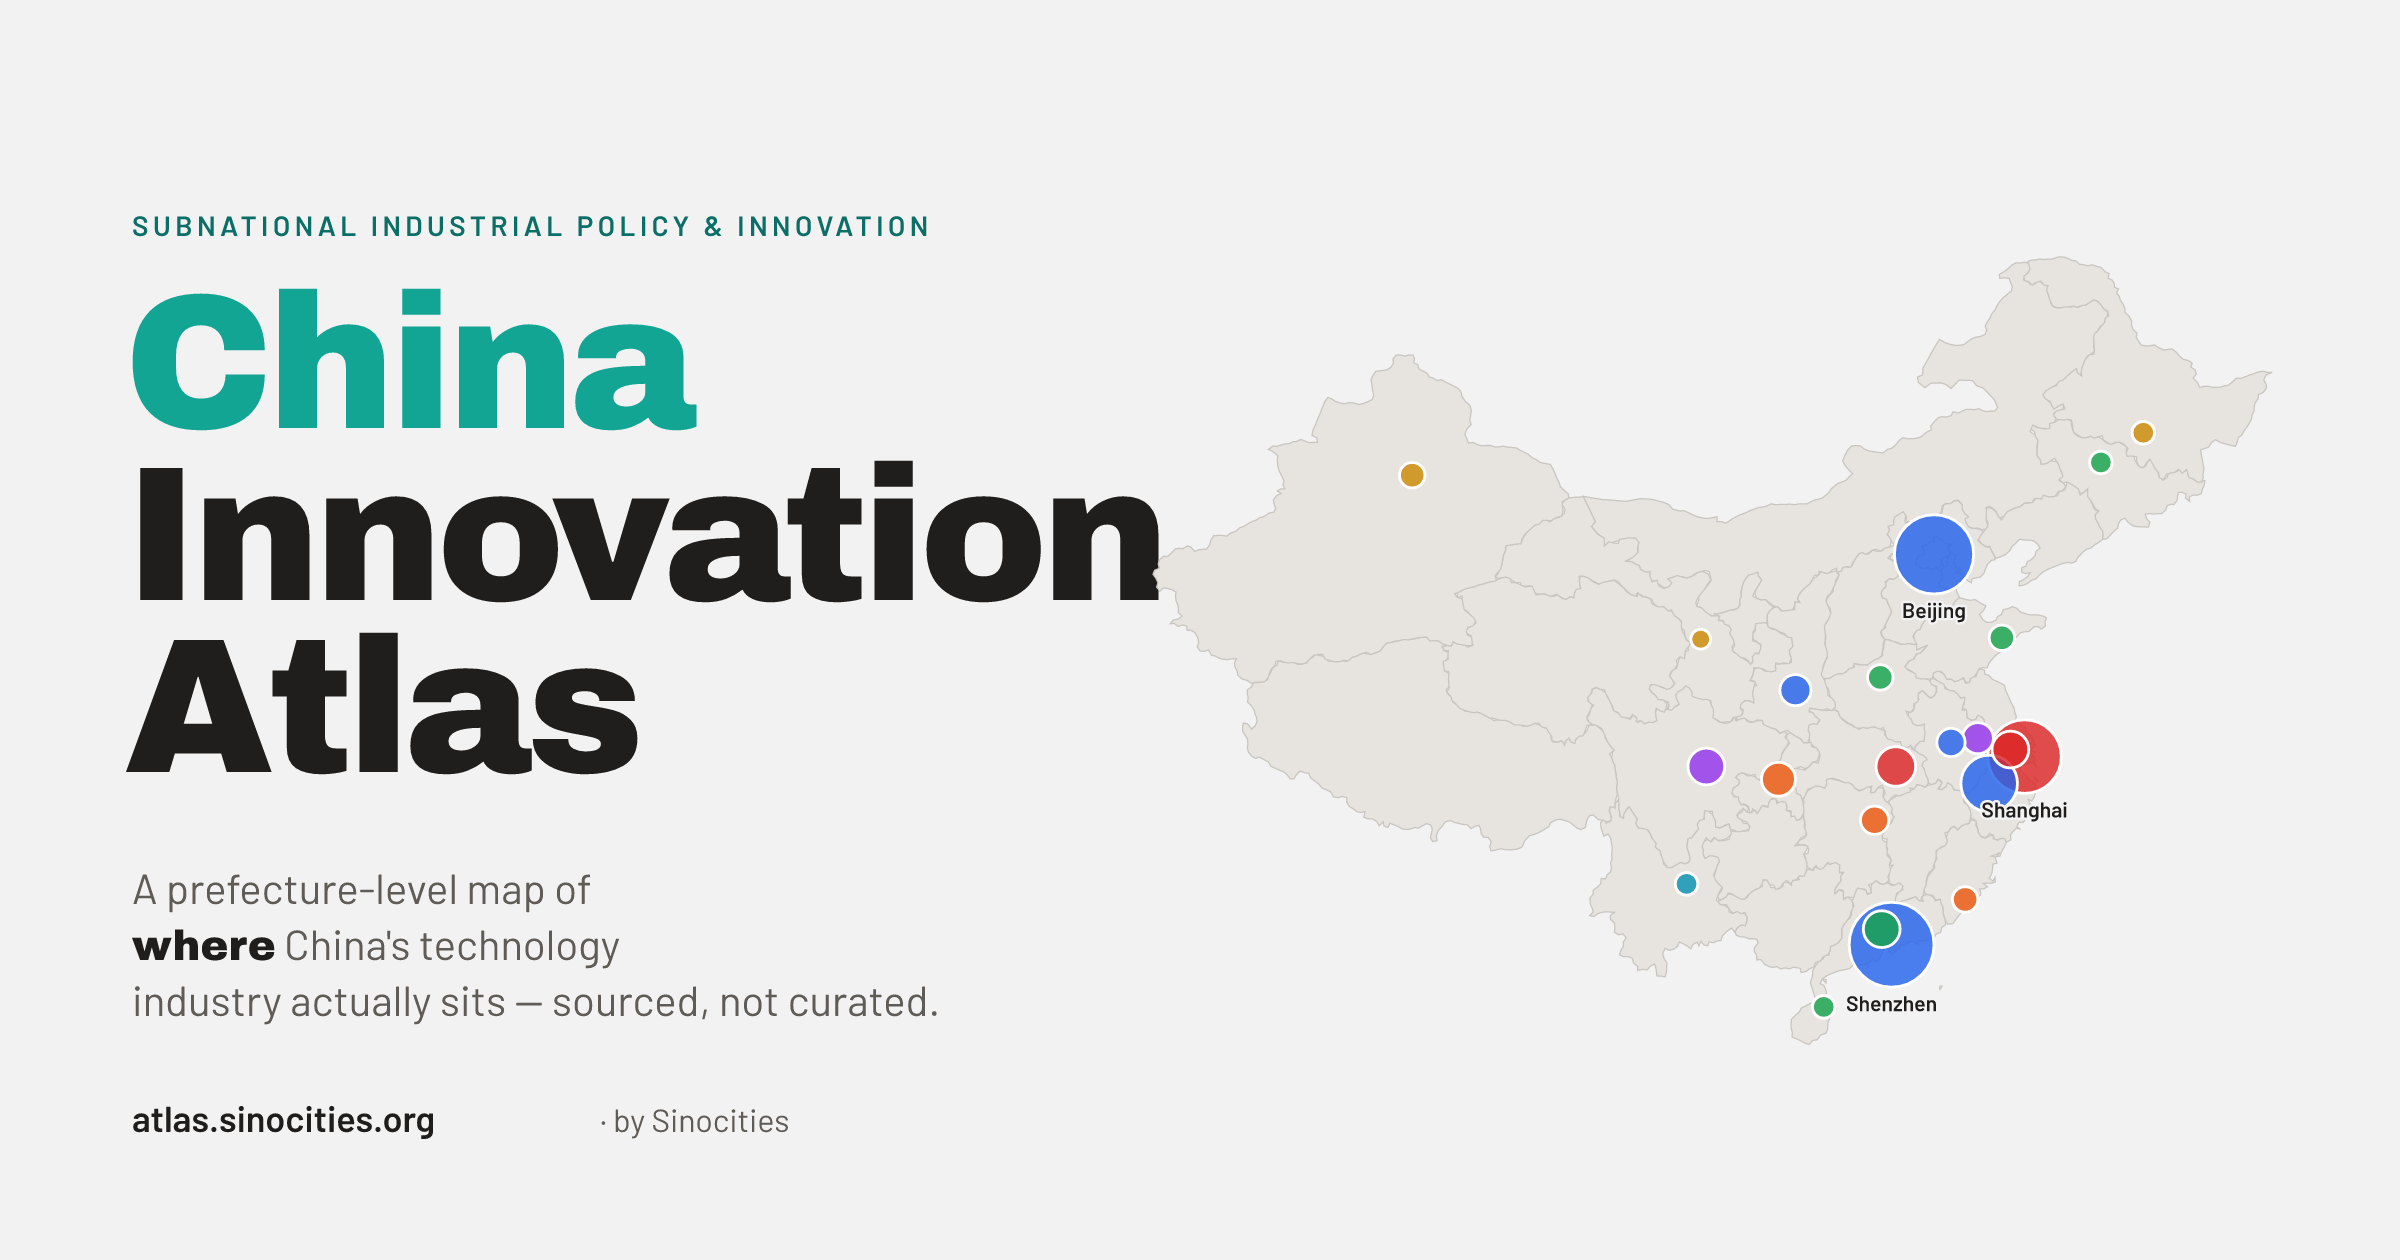
The dizzying pace of technological innovation is hard to keep track of. Whether the latest AI model release or a humanoid robot marathon, the advance of frontier technologies is dizzying to even the most seasoned observer. This is even more true for China, a country that is at the forefront of frontier technologies across a number of industries. Sinocities has been premised on the simple fact that to understand such a vast country as China, it is necessary to adopt geographically attuned and place-based narratives. Whether because of China’s unique model of “fragmented authoritarianism” or “local state entrepreneurialism” 1 or simply because of scale, understanding China requires adopting a place-centered lens.
This is also the idea behind China Innovation Atlas, a new project of Sinocities. I initially began to build this as a tool for my own research to help keep track of various geographic data, from autonomous vehicle pilot zones to data centers, to frontier AI models. All of these have a geographic pattern. And when juxtaposed over other types of data, the picture of where innovation is happening in China can reveal important trends and dynamics that are often overlooked in short news articles that focus on national-level headlines.
Some initial (mostly unsurprising) findings: Beijing (the city) dominates innovation across a key domains. It is especially dominant in research given the sheer concentration of top universities in the country.2 China’s coastal metropolises (Beijing, Shanghai-Hangzhou, and Shenzhen) dominate most frontier industries including AI, with rising inland cities like Wuhan, Hefei, and Chengdu coming up in certain areas.
This post introduces the atlas, and its key features. At its core, the atlas aims to provide several types of data to help researchers, journalists, and analysts of China make sense of the dizzying pace of technological change there. The project remains a work in progress, so stay tuned for updates and new features. If you find an error, a missing source, or a prefecture where the data doesn’t match what you know on the ground, tell me.
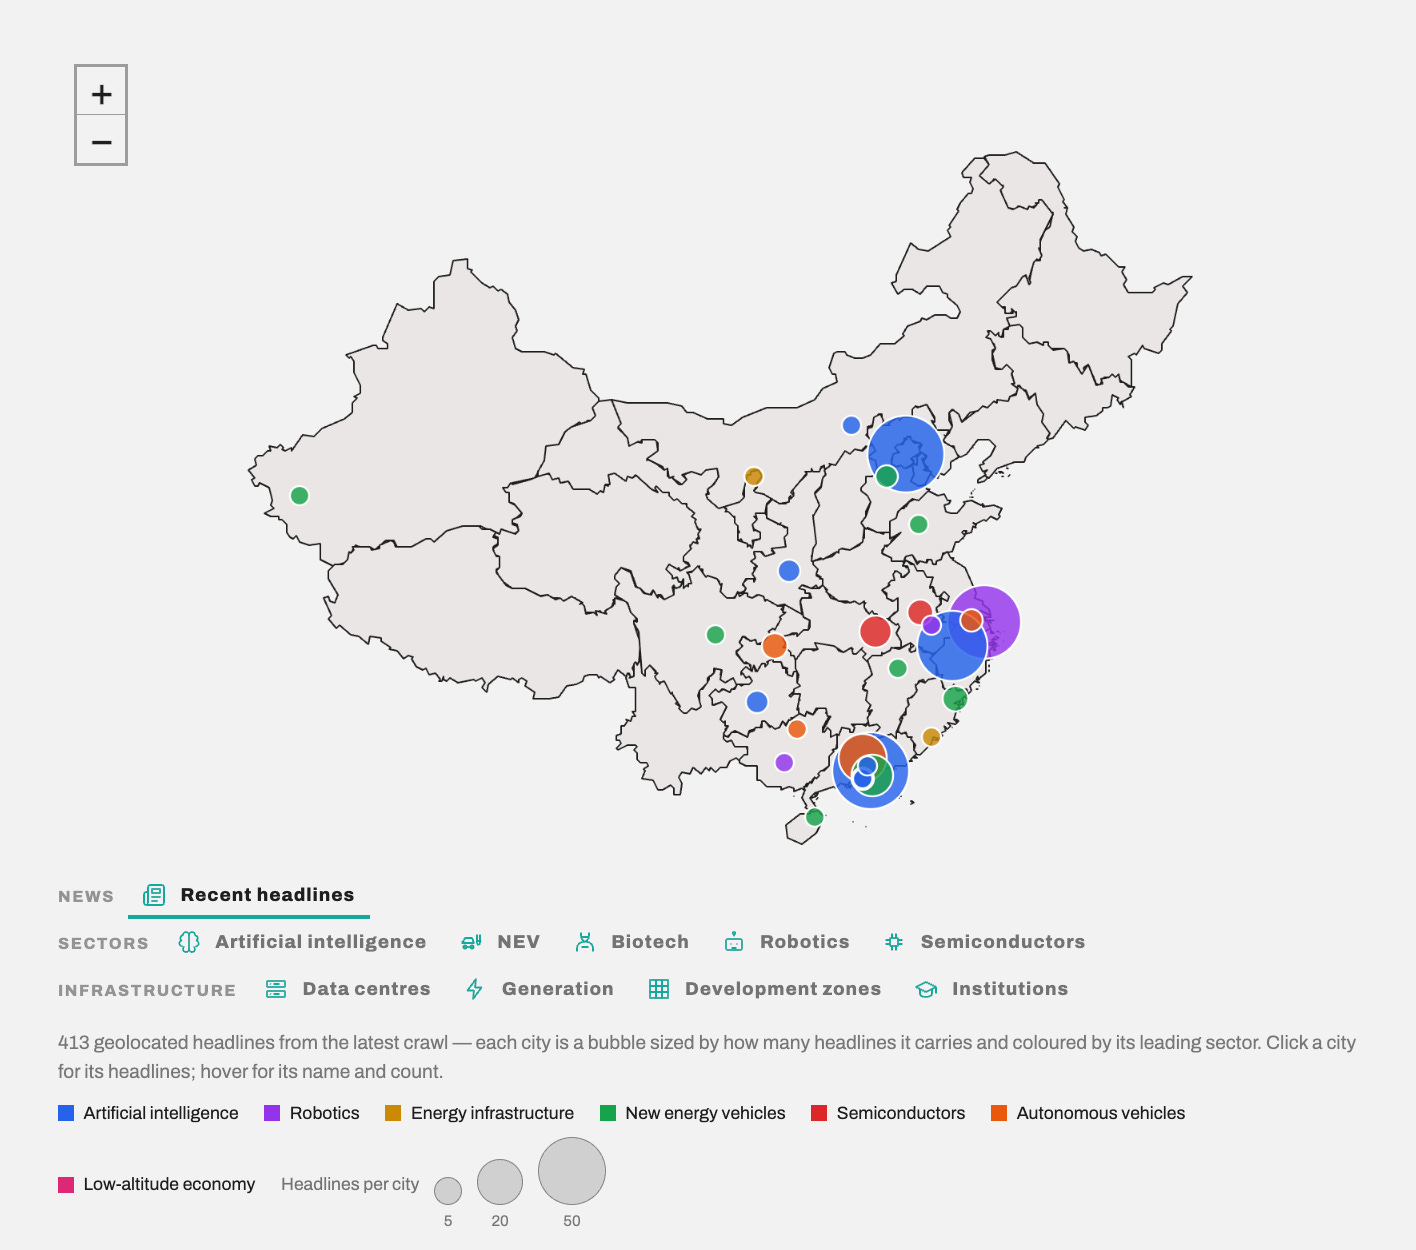
Overview map
The landing page provides a snapshot of the Atlas’s key data layers: News, featuring recent headlines geo-referenced to specific cities; Sectors, featuring industry-specific data; and Infrastructure, covering data centers, power plants, development zones, and leading universities.
These layers are organized according to how frequently they will be updated. Recent headlines will be updated weekly, sector-specific data frequently—approximately once a month—and relatively static infrastructure data less often, perhaps once a year.
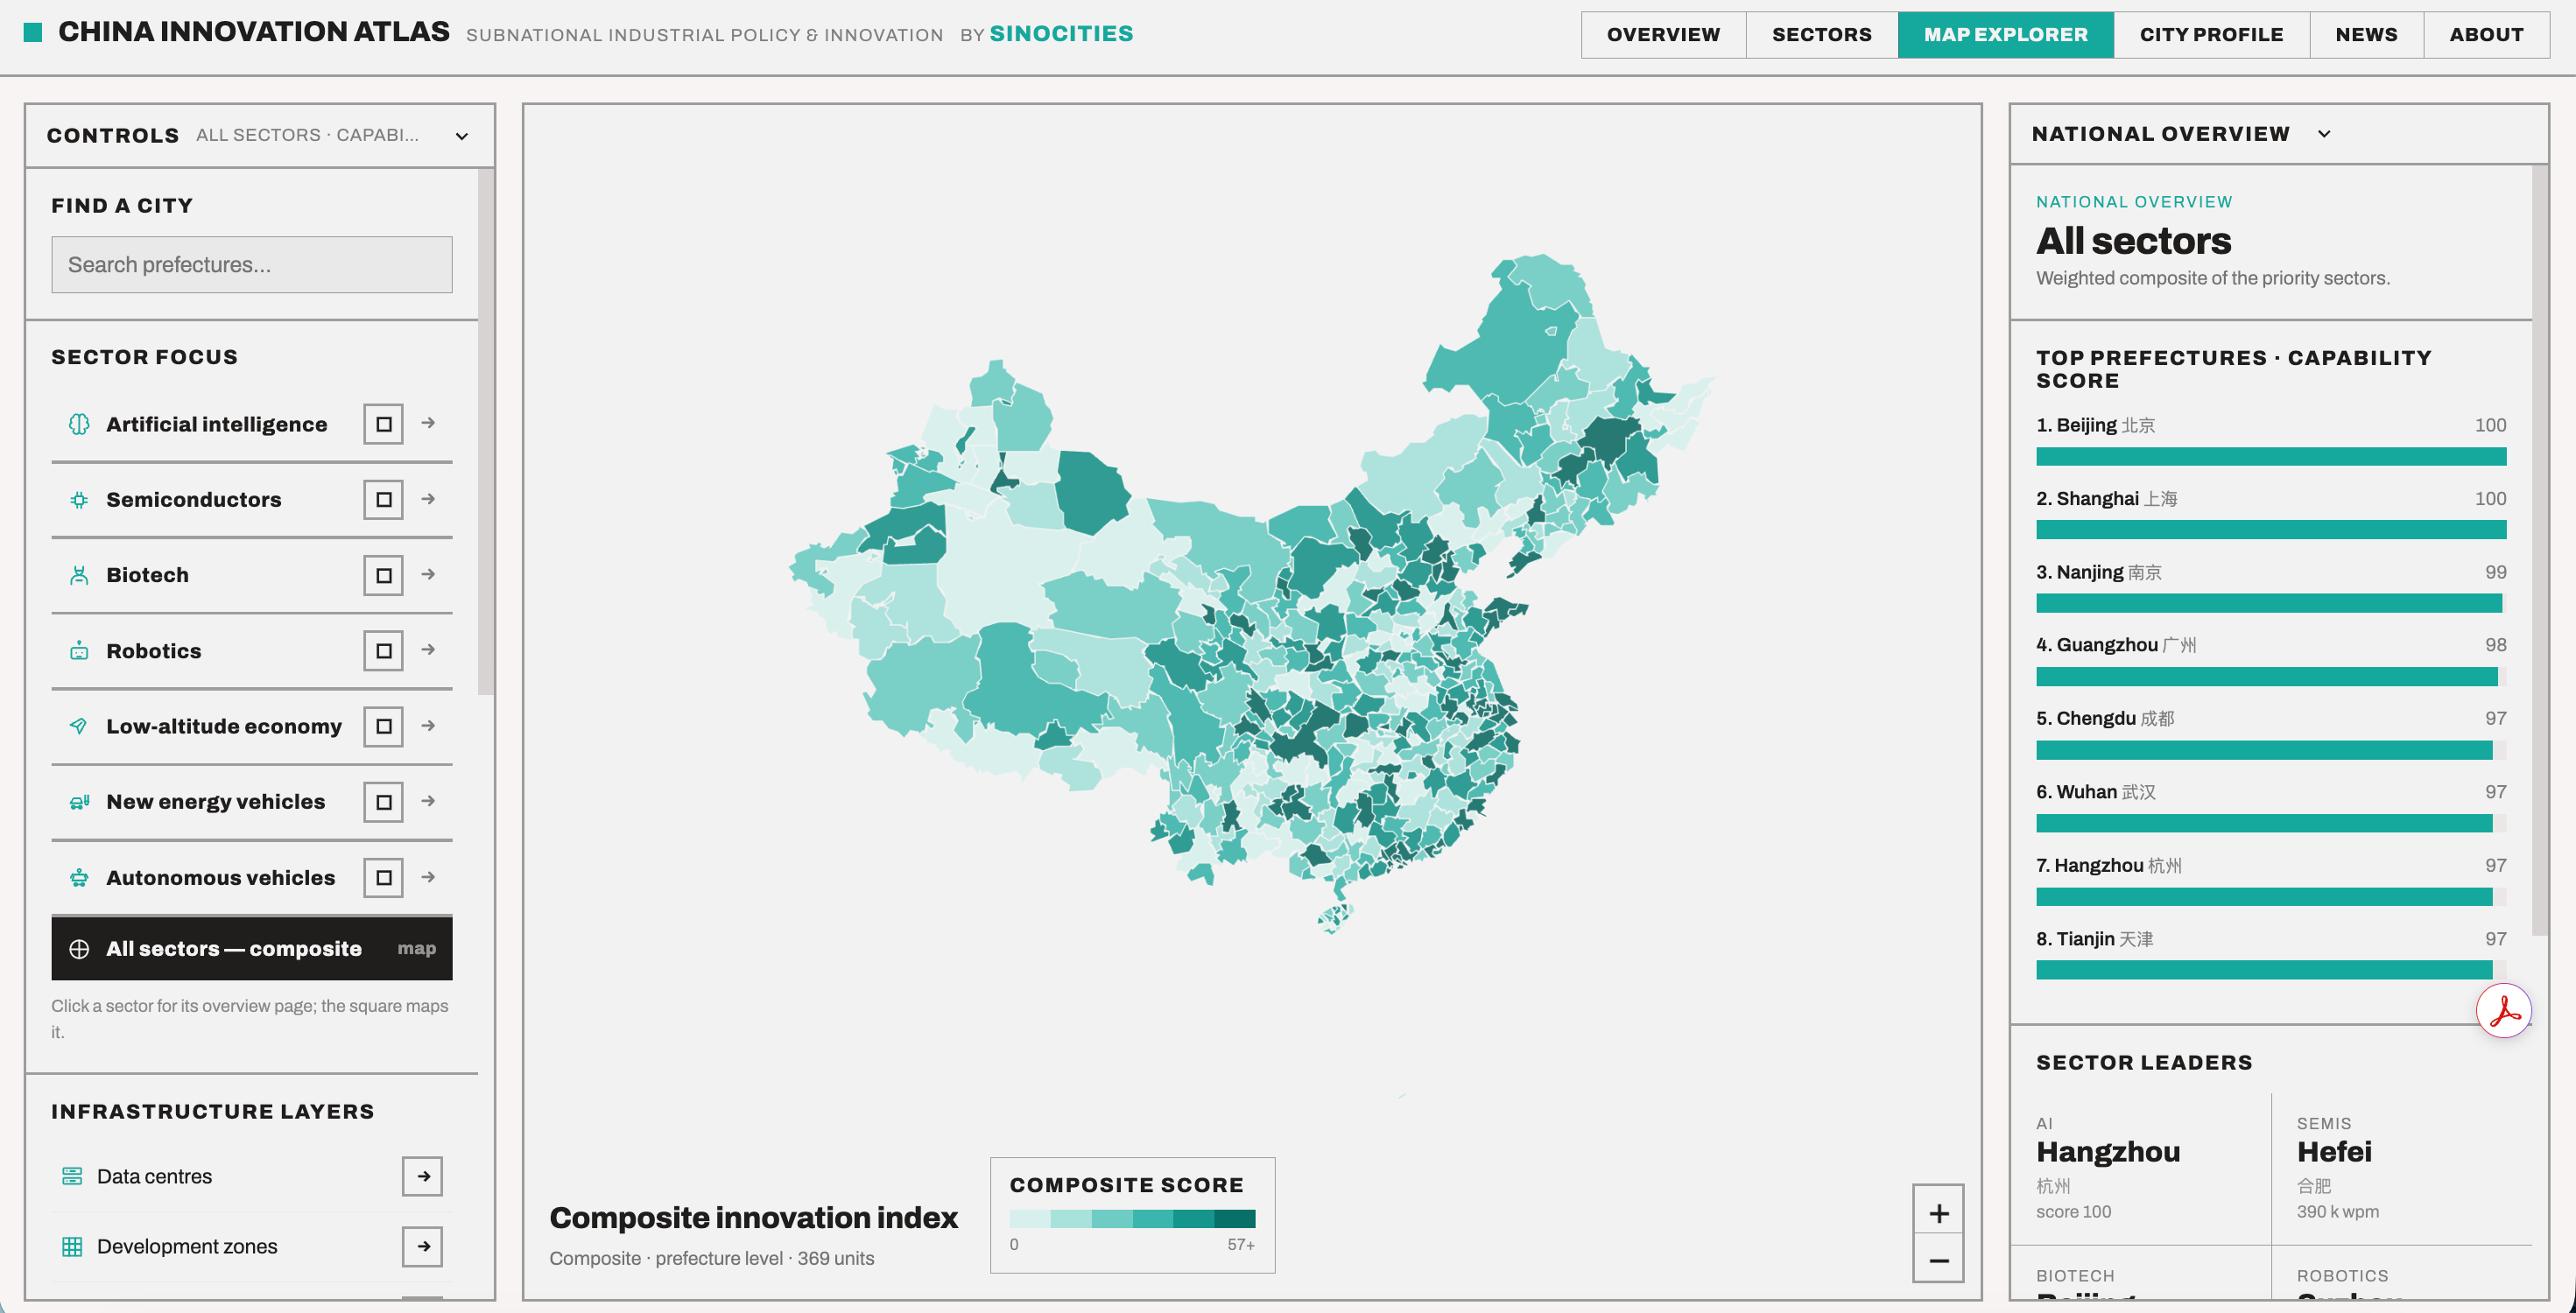
Map Explorer
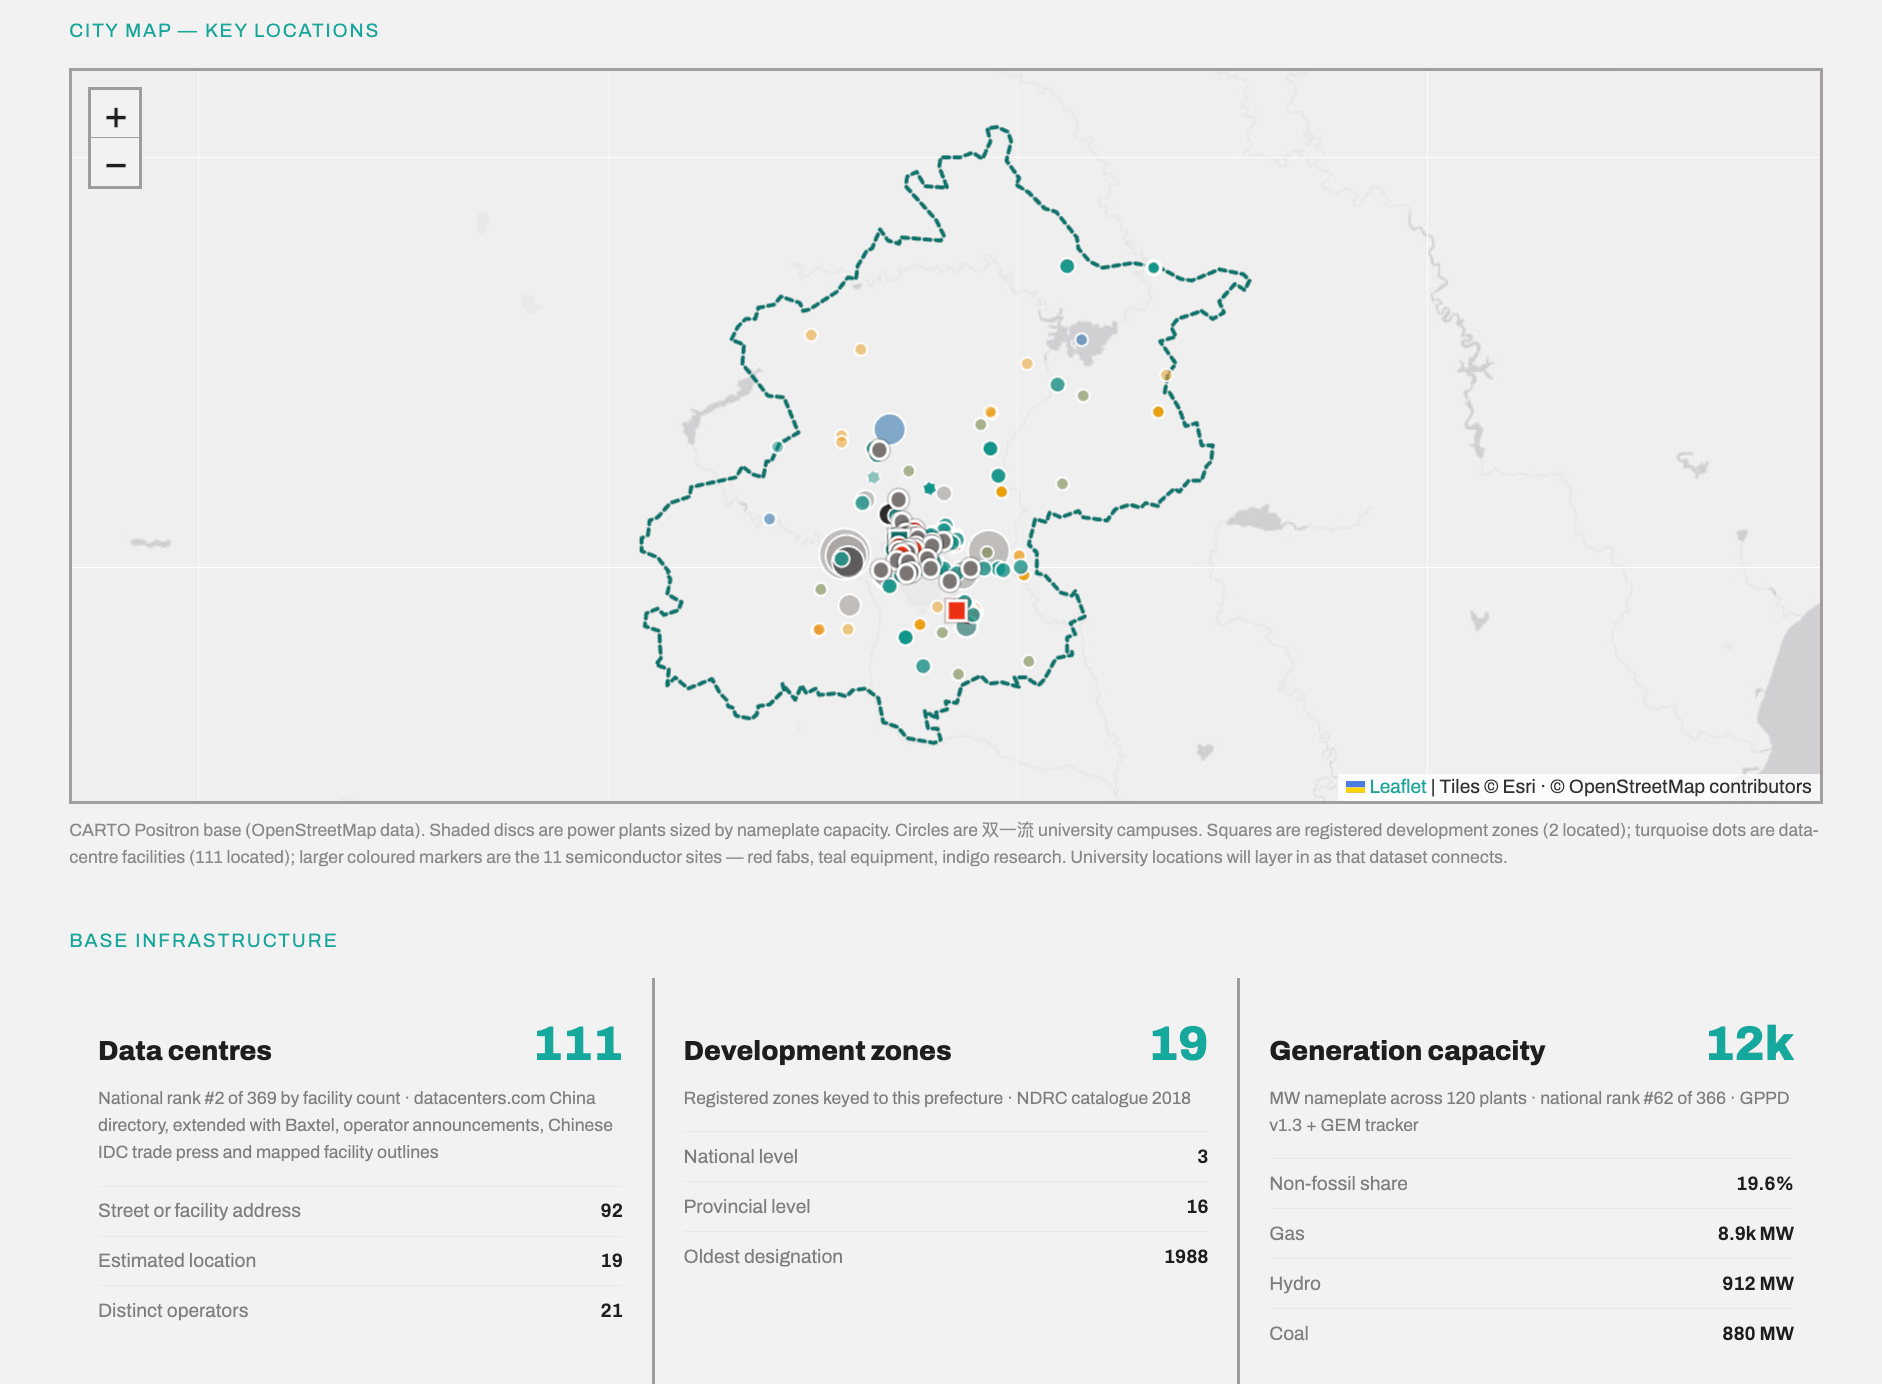
The map explorer interface allows the user to navigate across China’s prefecture-level units and provincial level cities to access each detailed city profile.
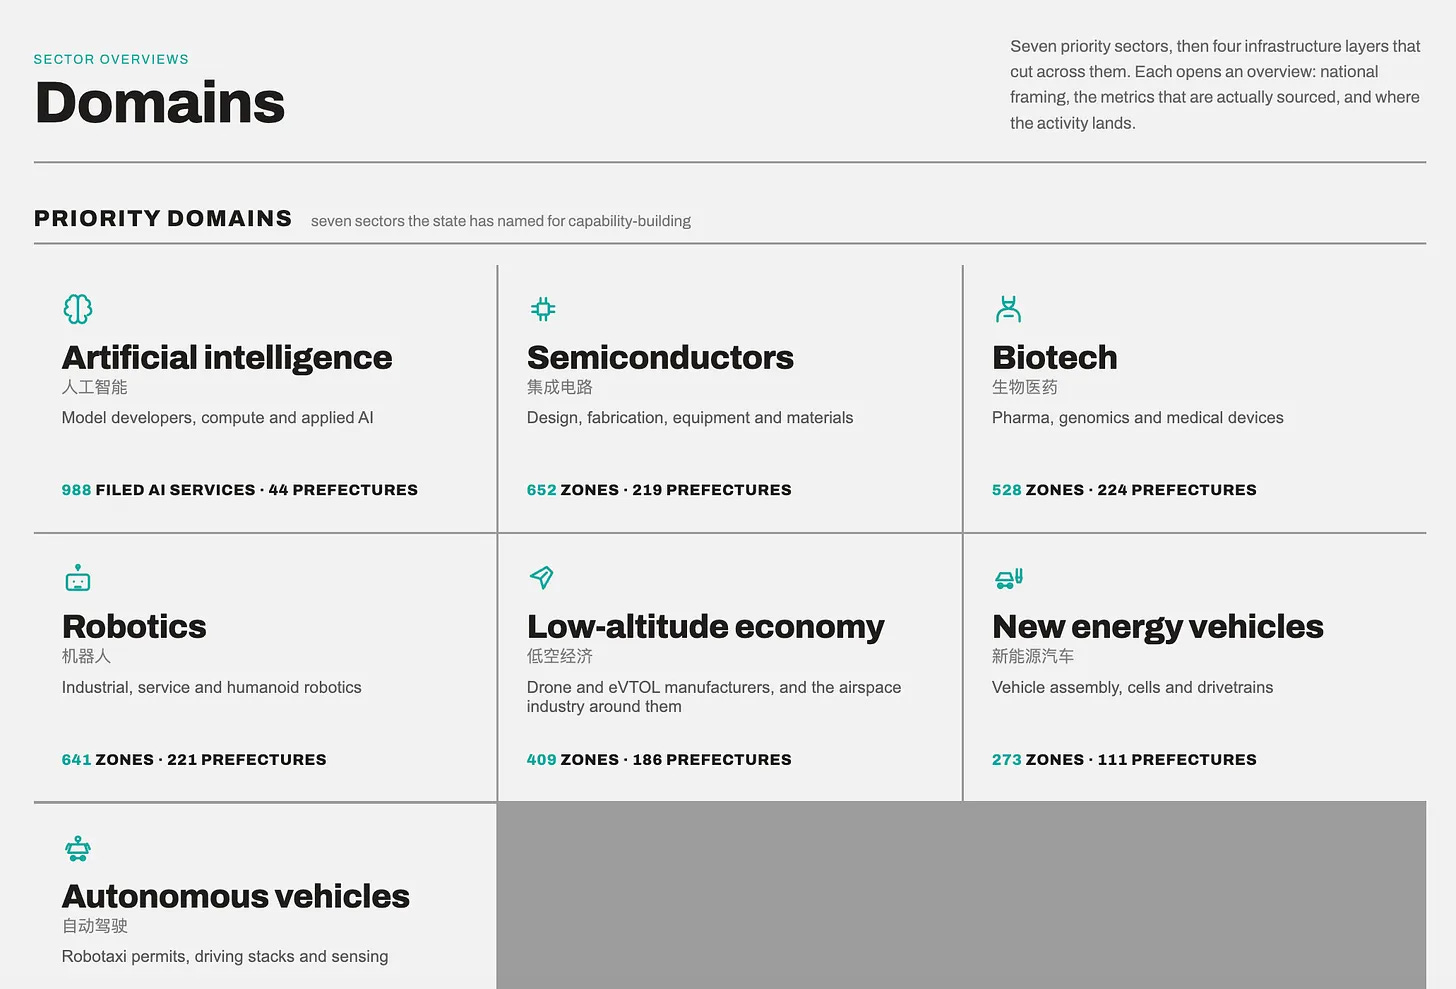
Domain Profiles
Each domain profile aims to provide a snapshot of where innovation in particular sectors is occurring. Each one will be customized, but will aim to provide an overview of key firms, research output, and other metrics of industry presence. Where available, a composite index will be created that will combine some of these metrics to give an overall view of how cities in China compare to each other in different industries or infrastructure metrics. For example, the Semiconductor page is currently based on a custom-built snapshot of China’s key indigenous semiconductor manufacturers across several cities. The Artificial Intelligence page captures data on AI-related algorithms and services registered with the Cyberspace Administration of China, an official list of AI models and services that is updated regularly. Data on research publications related to each sector are sourced from OpenAlex . The goal is to keep these updated and to provide more firm-specific data (coming soon). Additional sectors may be added in the future.
Prefecture/City Profiles
Every prefecture has its own page pulling together its indicators, sector positions, and sources, so the map is an entry point rather than the destination.
Recent Headlines
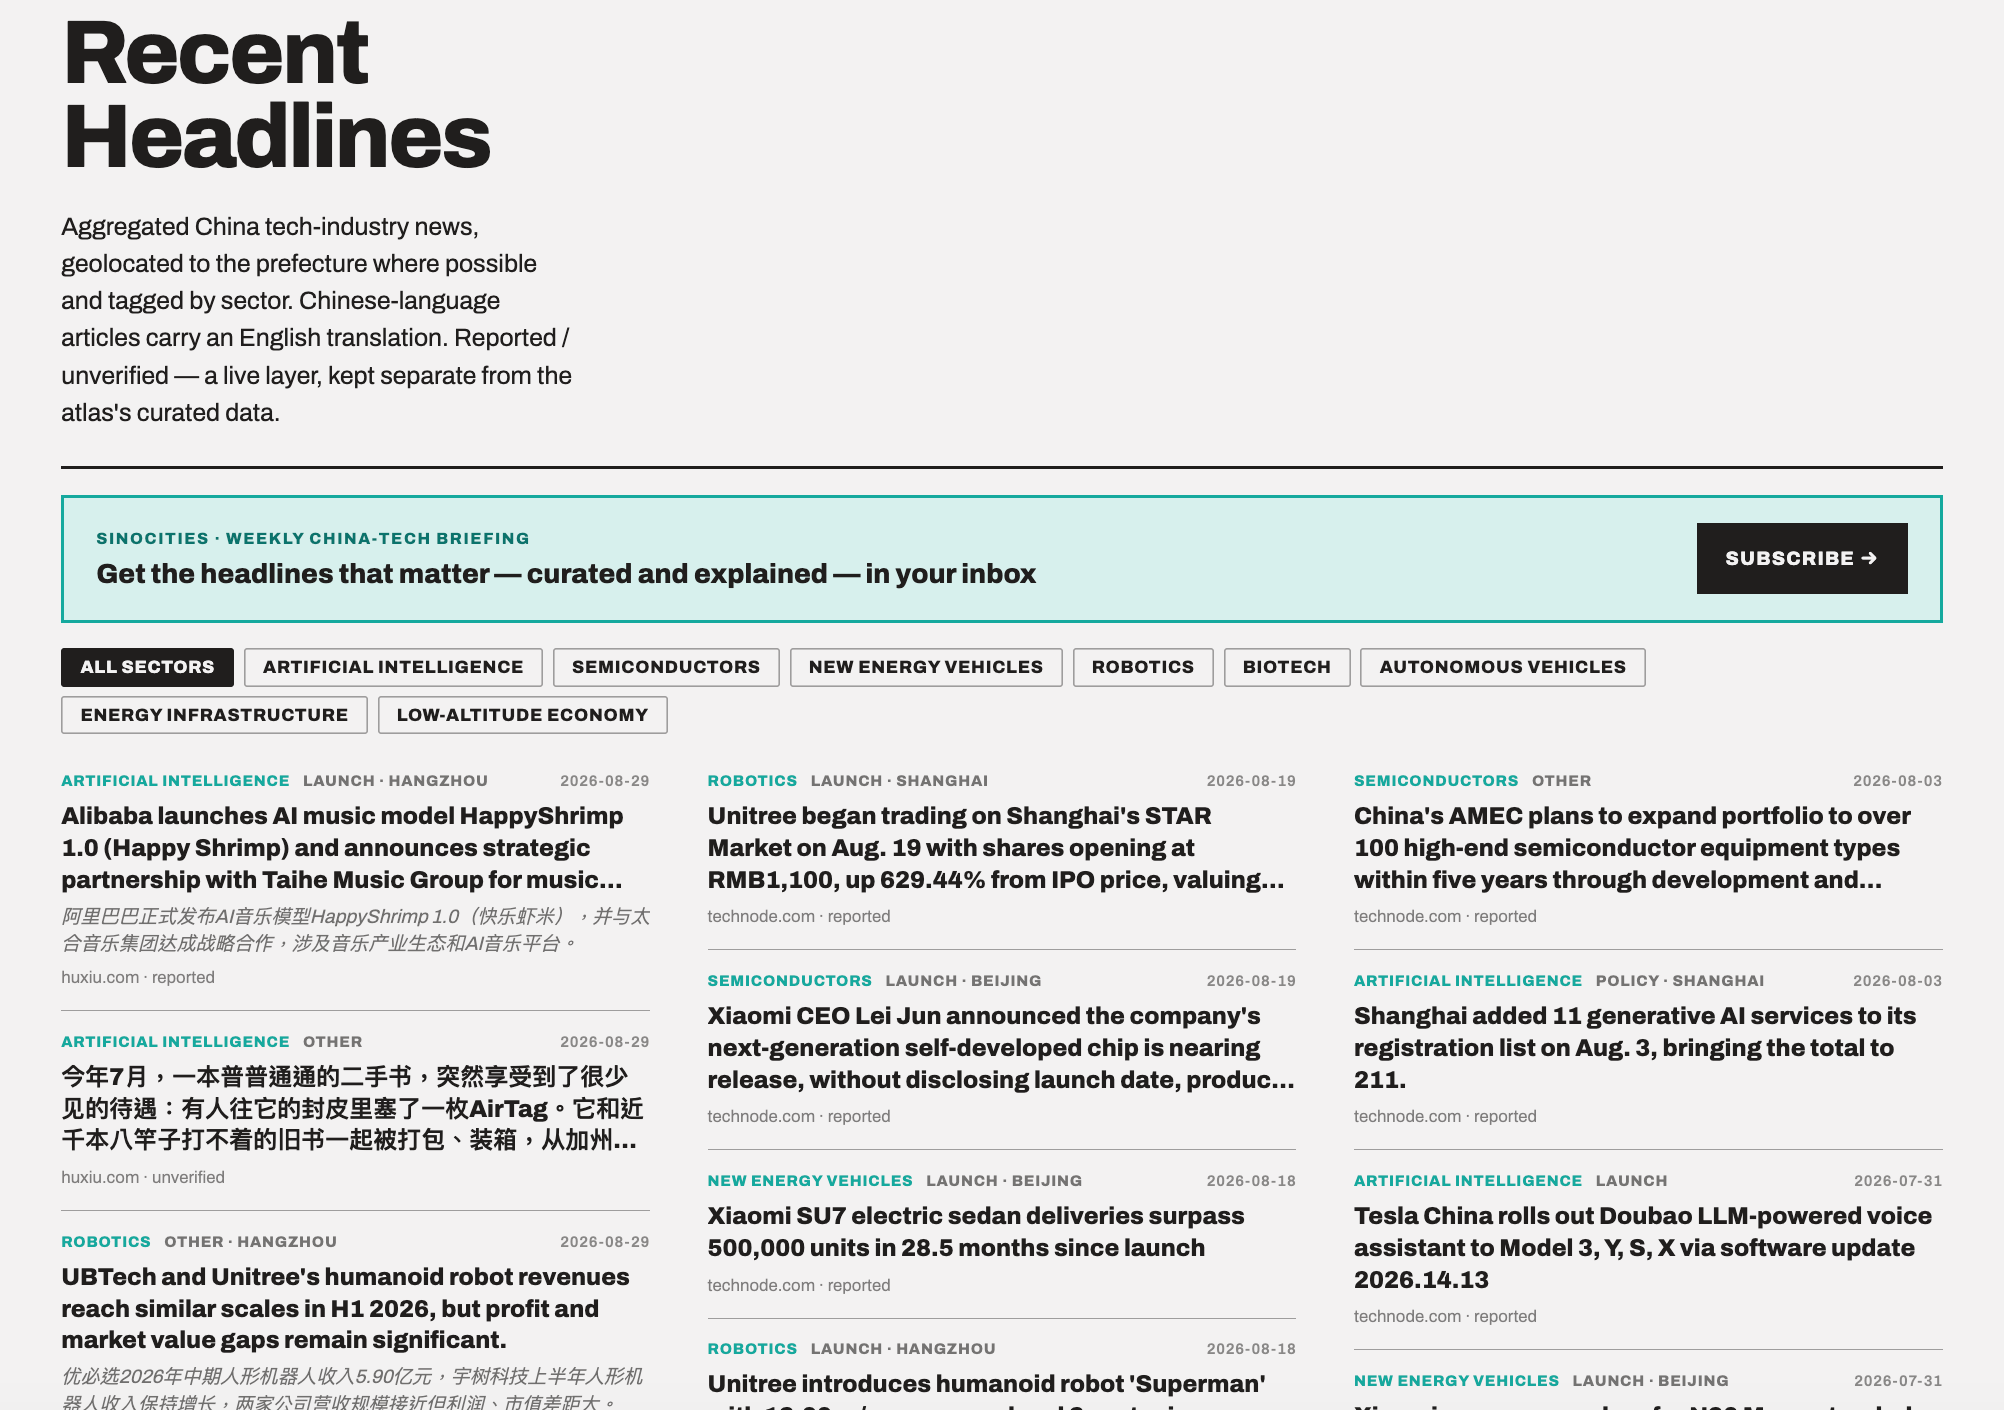
Like its name suggests, the Recent Headlines section aggregates recent headlines from a number of Chinese and English-language sites, providing short title translations when in Chinese. These headlines are also filtered to the Prefecture Level and Sector-Level by keyword, but this page will show all headlines from the most recent fetch. The goal is to update this at least once a week.
The Atlas is a companion to what I write here rather than a replacement for it. Maps are good at showing distribution and bad at explaining causation; the essays will keep doing the second job. But a lot of arguments about Chinese technology policy turn on empirical claims about geography that are rarely checked, and having those claims in front of you tends to change the argument.
Lieberthal, Kenneth, and Michel Oksenberg. 1988. Policy Making in China: Leaders, Structures, and Processes. Princeton University Press.
Wu, Fulong. 2020. “The State Acts through the Market: ‘State Entrepreneurialism’ beyond Varieties of Urban Entrepreneurialism.” Dialogues in Human Geography 10 (3): 3. https://doi.org/10.1177/2043820620921034.
Using data from OpenAlex.org
Amazing tool! Keep it up.
Awesome!